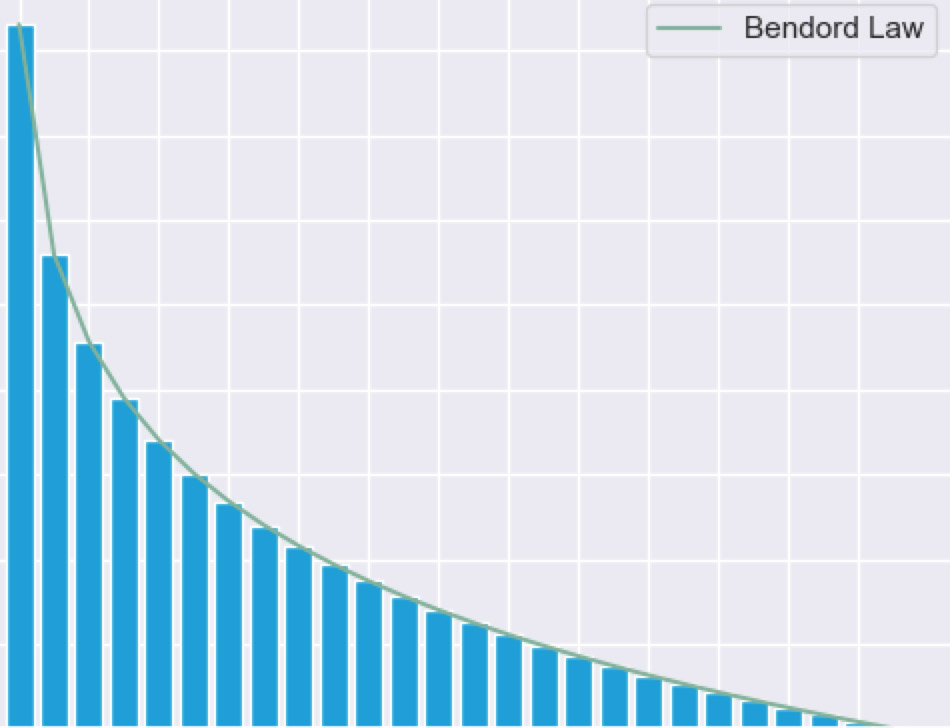
Benford is an observation about the frequency distribution of leading digits in many real-life data. This graph combines Benford law with the custom probability function from (First Letter of Word) paper to show Benford's magic for text corpus.
1: represent the most-used first letter frequency,
2: the 2nd most-used first letter, etc.

Data visualization technique to represent the most used words from your corpse (not-including stopwords) in a handy graphical image.

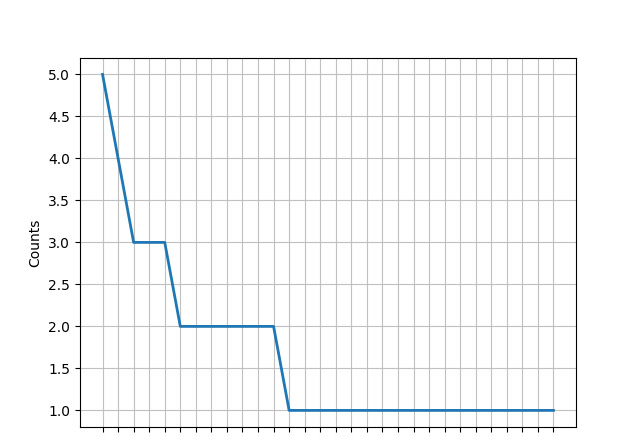
Generate a frequency distribution histogram that represents all words (not-including stopwords) from your text. This tool useful to understand the text before processing and compare between different corpora.

Statistics summary represents your text; these insights are useful before applying text processing or analysis.
Note that sentence counter works best with paragraphs that include punctuations.
TextMiner uses pos tagging to understand the relationship between words and sentences.